
Rather than writing individual posts for each of the sections below, I have decided to cram them all into one big update post about what I have been working on since my last post.
Overture
So it has definitely been a while since I last posted anything on this blog (just over a fortnight). I figured, rather than abandoning this blog after only one week of posting, I will give a (hopefully not too long) update about what I have been doing during my hiatus from blog-writing.
Pre-Hiatus: Can Calculus Cure Cancer? (Sydney Ideas)
To start off, this happened a month before I started STEM Vault, so this really doesn’t count as being part of what I did during my break. But if I don’t write about it now, it’s (probably) never going to happen ever.
On November 12, I visited the University of Sydney to watch Can Calculus Cure Cancer?, a Sydney Ideas talk presented by Professor Helen Byrne from the University of Oxford, and Professor Jennifer Byrne, the Head of the Children’s Cancer Research Unit at Westmead.
If you would like to listen to the talk, use the Soundcloud widget below.
Some personal highlights from the talk:
- The main take-away message I got from the talk was that mathematical modelling can be used to improve clinical outcomes for patients with cancer.
- For example, mathematical modelling of brain tumour cell growth and movement can be used to give doctors suggestions for where they might find tumour cells (that are otherwise missed by MRI scans). Modelling has also helped scientists refine how treatment is administered to patients.
I would strongly suggest giving the talk a listen if you want to learn more about how Mathematics, Science and Medicine intersect in interesting and important ways.
Beyond the main topic, I would also like to draw your attention to two additional things from the talk:
- Our World in Data was featured early in the talk. To summarise, data about worldly issues (such as CO2 and other greenhouse gas emissions, smoking and plastic pollution) are visualised, explained and made accessible to the general public. Overall, it is an excellent resource to browse through for statistics that are worth analysing and having discussions about.
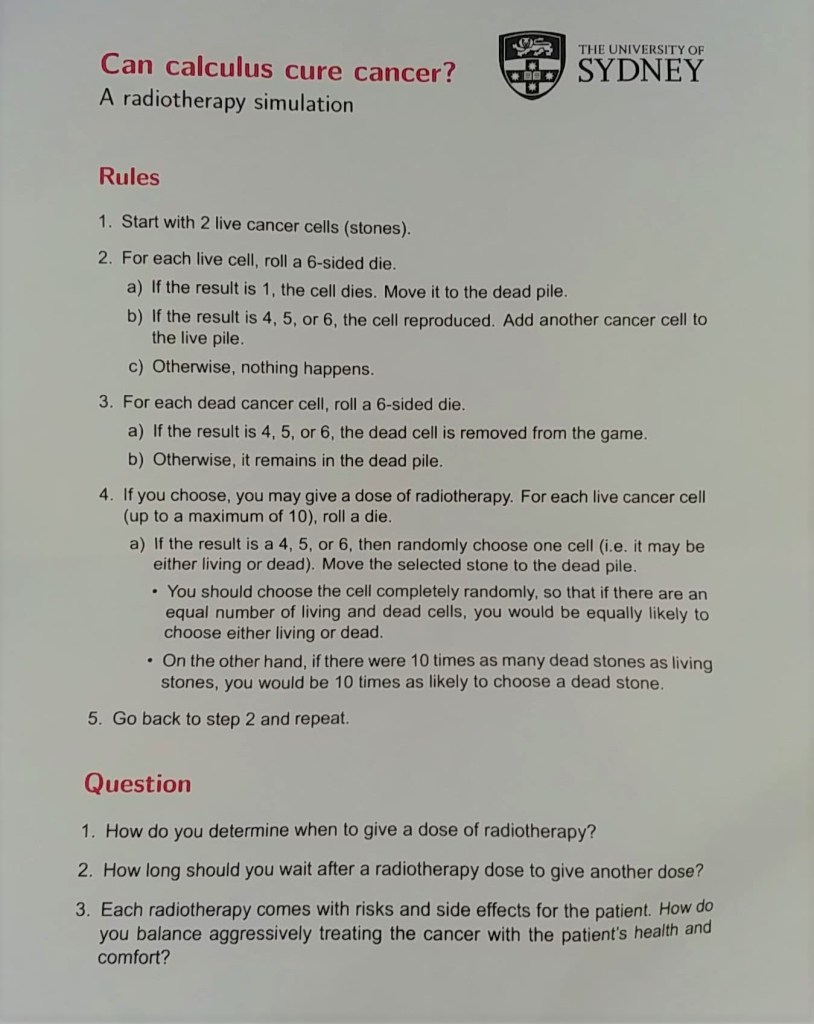
- The radiotherapy simulation game (see picture below) is a simple activity that encourages the player to consider when it is most optimal to give doses of radiotherapy to patients.
- Note that dead cancer cells do not vanish once they are dead; they take time to be processed and removed from the body.
- Also, whilst not explicitly part of the game, a patient’s comfort and health are additional factors that should be taken into consideration when deciding when to give doses of radiotherapy.
December 11: Hunting for Concrete Materials
Before joining the Town Hall climate rally on December 11, I made a pit stop at the University of Sydney’s Fisher Library to search through their curriculum section for a couple hours. Of interest, they had a range of teaching aids that I think could be of use in the mathematics classroom:
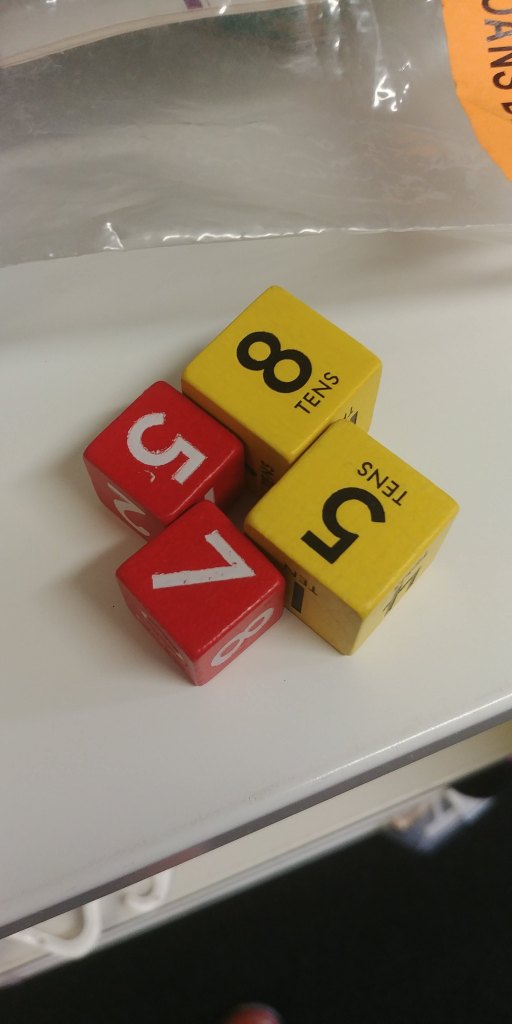
I thought that these dice were decent; the small red dice represents Units/Ones, while the bigger yellow dice represents Tens. They’re not super necessary (using different coloured dice would suffice), but students might find them fun when generating random numbers. 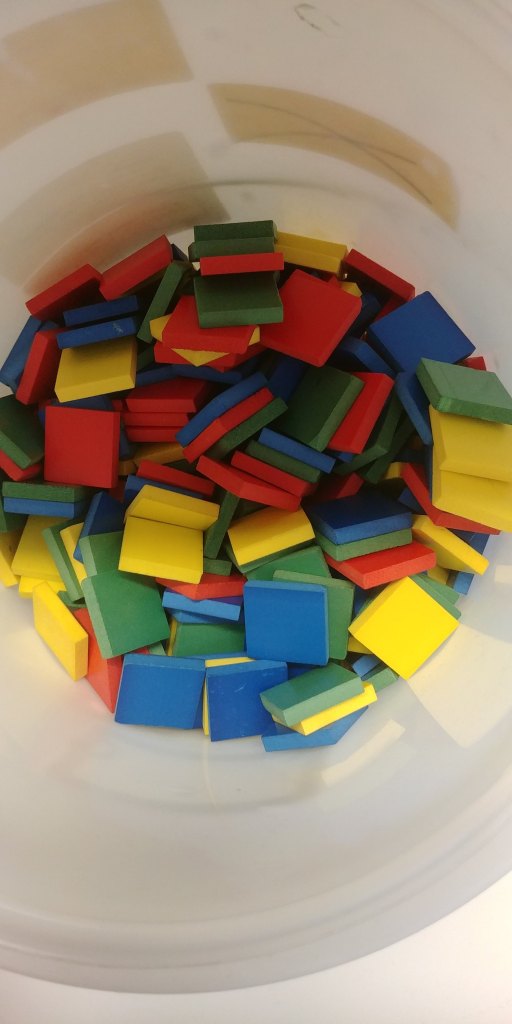
Not too sure what or where you could use these coloured square tiles. My initial ideas for these would include geometry, area and perimeter, as well as perhaps tessellation. You could also use them to visually demonstrate patterns, such as square numbers. The colour variety can also allow students to make colour-based sequences. 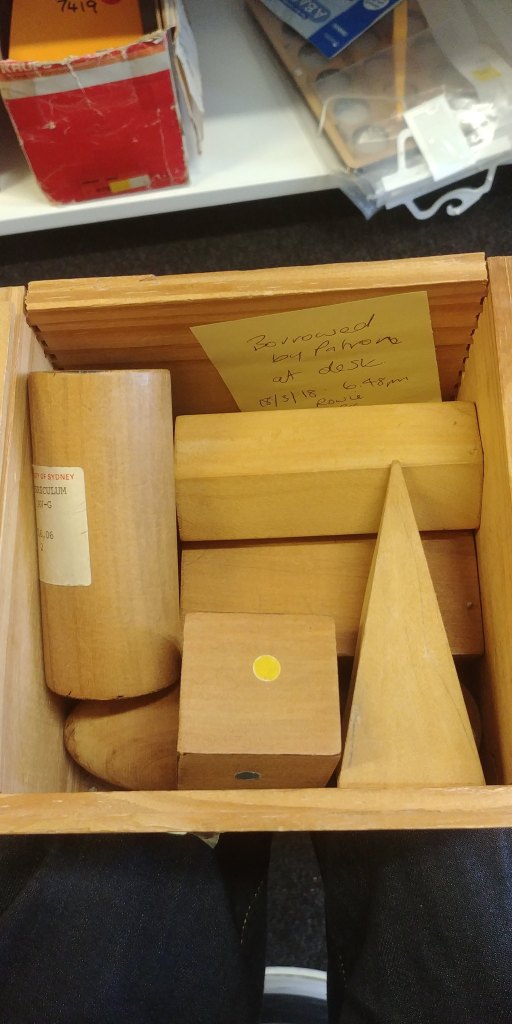
These wooden 3D solids don’t seem to be used that much in secondary classes. You could get students to determine their volume and surface area by providing them with measuring tools, as well as construct composite solids. 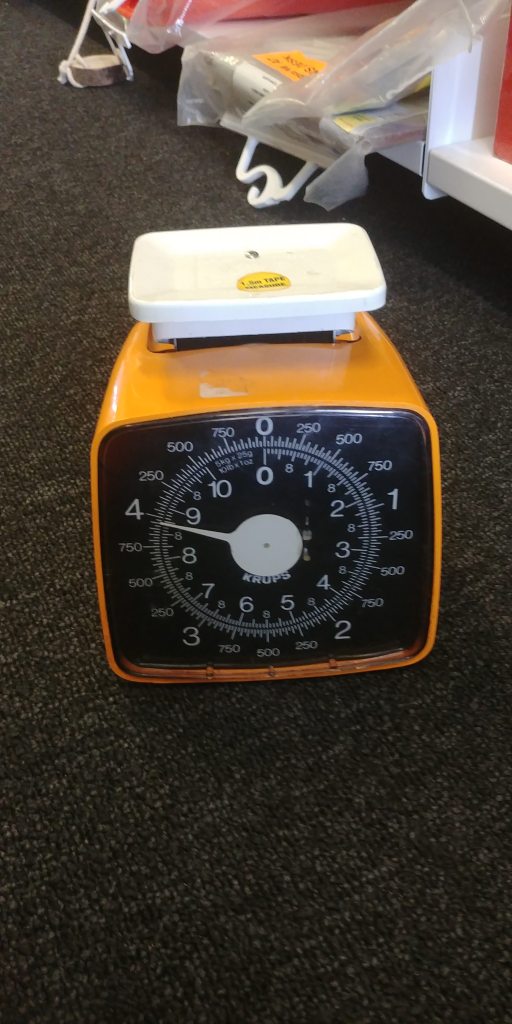
I think it’s worth bringing kitchen scales (mechanical and digital) into the classroom just so students get more experience with using and interpreting them. It’d be also valuable to get students to estimate the masses of common items, food or otherwise, in order to refine their frames of reference. 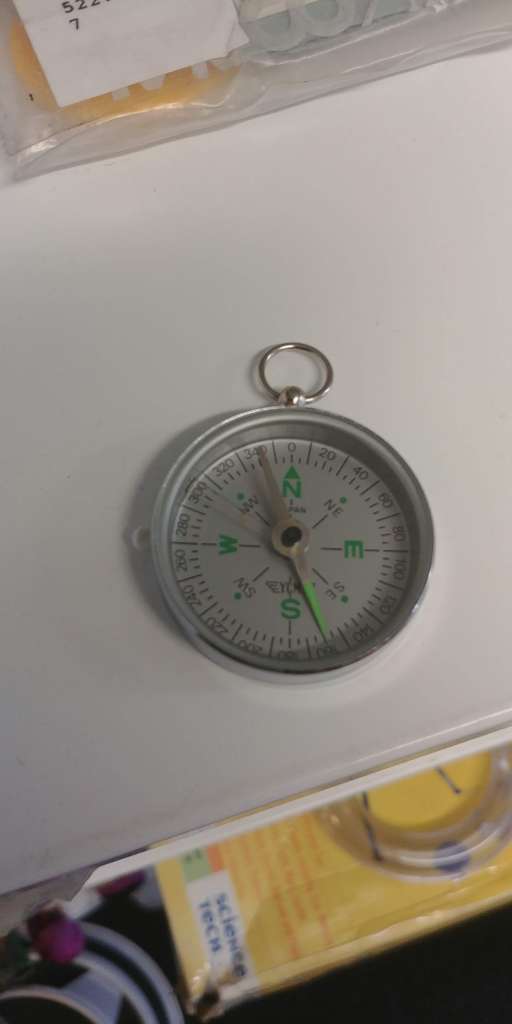
It might be interesting to take students outside of the classroom to practise orienteering; give students a map of the school and control points/flags to locate by giving them compass directions and distance. 
Cuisenaire rods are useful for studying arithmetic (and building wooden structures for fun), e.g. visually demonstrating how numbers can be broken down into factors. 
I believe that the trundle wheel is underrated and should be used more often in and outside the mathematics classroom (e.g. measuring the length of a building). You can also use the trundle wheel to demonstrate the relationship between circumference, diameter and pi (rotating the wheel once covers a distance pi times the diameter, or approximately about 3 trundle wheels side-by-side). 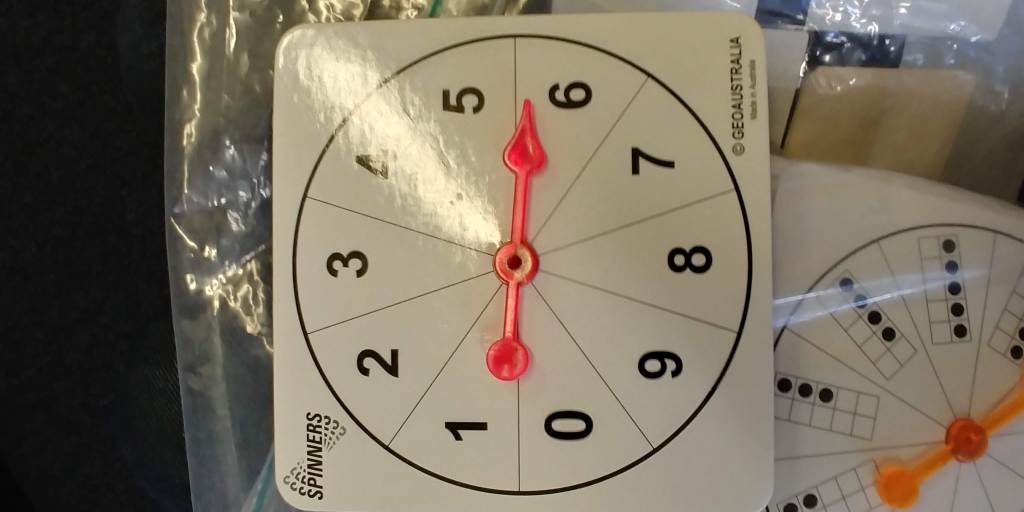
Spinners are useful tools for demonstrating probability concepts, such as theoretical and experimental probability. Students should also be given the opportunity to design their own spinners, fair or biased towards certain outcomes. 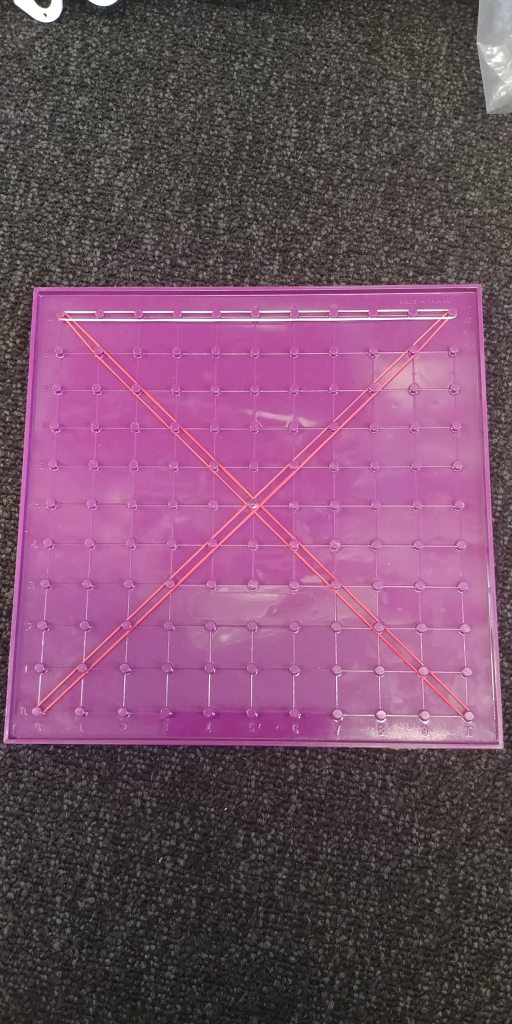
Pegboards (and elastics) could be used to teach coordinate geometry and the Cartesian plane. You could also manipulate the elastics to create simple shapes (like triangles and quadrilaterals) to study perimeter and area. I wouldn’t try to make a circle though. 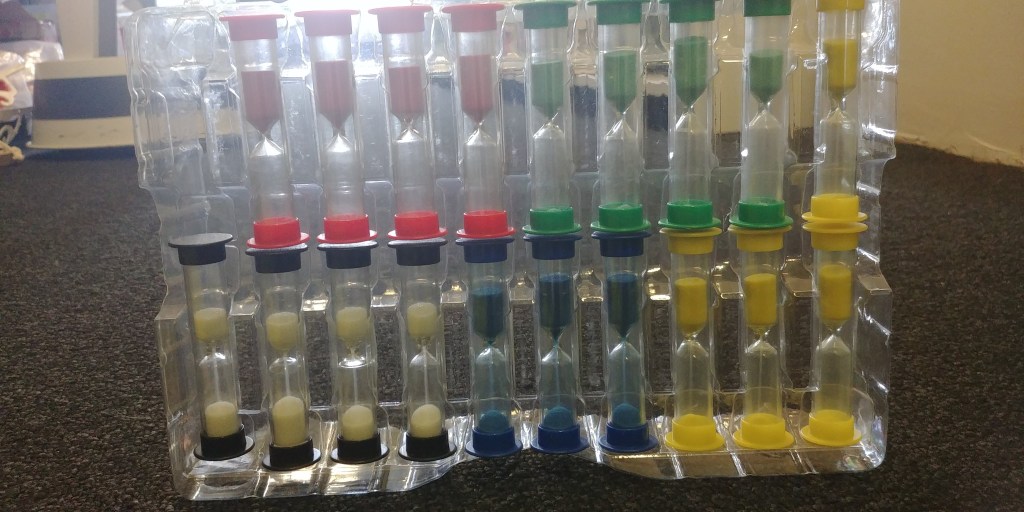
It might be worth getting students to investigate how timers like these work, as well as to potentially calculate how much sand falls per second. 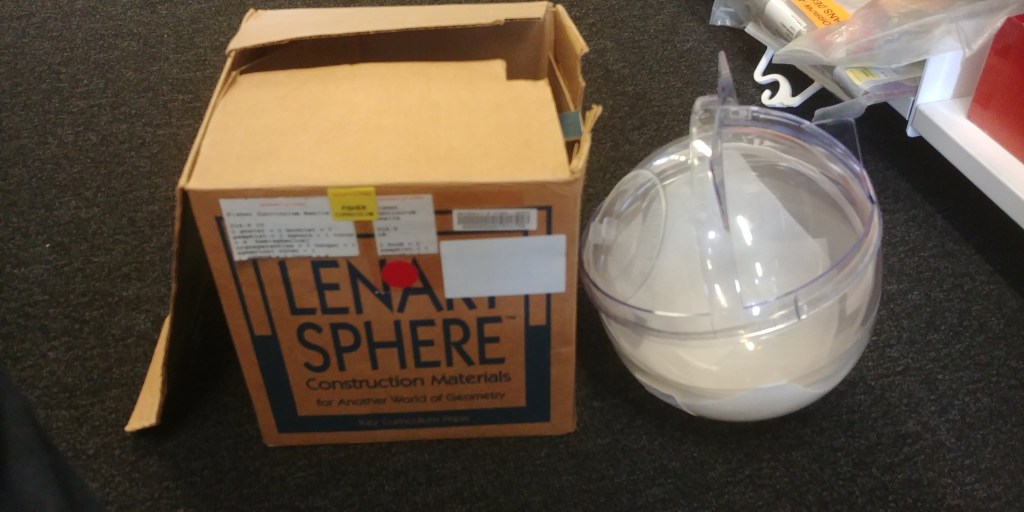
This was the oddest item available in the collection; Lénárt spheres are used to teach spherical geometry. There’s no real use for this tool in the current syllabus, but perhaps one day students will study non-Euclidean geometry in preparation for studying senior Physics.
December 13: Maths300 Workshop
A couple days later, I attended MANSW’s Maths300 Professional Learning Workshop in Auburn to learn more about how the lessons were originally designed, as well as to contribute suggestions for revising them in preparation for their re-release on the new upcoming Maths300 platform. The following lessons were discussed:
- #186 Addo: bingo-style game involving basic addition
- #22 Algebra Walk: kinaesthetic model for graphing linear (and quadratic) equations
- #133 Angle Estimation: physical activity for recognising angles and estimating their size
- #43 Area of a Circle: iterative approach for determining the radius of a circle given area
- #44 Area of a Triangle: strategy for converting triangles into rectangles for the purpose of calculating area
For this blog post, I’ll focus on my thoughts on #43 Area of a Circle.
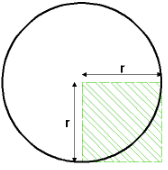
The original lesson proposes to students that in any given circle, you can fit approximately 3.14 squares (with side lengths equal to the circle’s radius) inside the circle. Note that this is not the key focus of the lesson, but is important for later determining the radius of a circle given its area (the equation is approximated to A = 3.14 x R x R).
Rather than taking this approximation for granted, I would instead suggest getting students to actually determine this by providing them a large circle cutout (or outline) and four squares (each preferably with a 10×10 grid pattern).
Instruct students to cut the squares up in such a way that they can then paste them within the circle boundary. What they should find is that they’ll be able to fit just over 3 squares. If they are given grid-paper squares, they can also more accurately determine how much of the 4th square they used to fill in the remaining space in the circle.
Outside of this, I think that the lesson overall works well to demonstrate that iterative processes are a valid alternative approach to algebraic solving. The trickiest part of the lesson is explaining what corner squares are (which can be done with a simple diagram).
Speaking of problem-solving, below is a toolbox of problem-solving strategies. These were handed out during the workshop, but they’re also popular enough that they can be searched for on Google.
Note that it will not be enough to give this list of strategies to students and expect them to be great problem-solvers; these strategies need to be actively considered and modelled whenever you look at problems as a class.
| Act it out | Make a model |
| Work backwards | Look for a pattern |
| Solve a simpler problem | Draw a diagram |
| Have I seen a similar problem? | Break the diagram into manageable parts |
| Make a table | Seek an exception |
| Guess & Check | Test all possible combinations |
To end off this section, I want to draw your attention to two other example activities that were demonstrated during the workshop:
Example Task: Sticky Notes + Data Representations
This activity required sticky notes and some tape. To summarise, participants were asked to select which cuisine they preferred the most. Four options were provided, each represented using different coloured sticky notes.
Participants were required to take one sticky note (matching their preferred cuisine), and stick it on the whiteboard. The sticky notes were arranged in columns and evenly stuck on top of one another. The end result resembled an upside-down column graph.
Each column can then be taken down from the whiteboard and (reinforced using sticky tape) connected to each other end-to-end (i.e. the end of one column was connected to the start of the next column). The last column was then connected to the start of the first column, creating a ring of sticky notes similar to a pie chart.
At this point, you can place the ring on some butchers paper and draw an outline of the ring, as well as additional lines to indicate the different sectors of the chart. If you scale the diagram (by extending the lines) and use a 100 bead string, you can also determine the (rough) percentages each sector represents.
Example Task: #163 Building Views (available on Maths300)
This activity required wooden cubes. To summarise, students are given the front and side view of a 4×4 building structure made out of cubes. Students use this information to create all of the possible buildings that could result in those front and side views.
Alternatively, students are given information about the top view (and the number of blocks stacked on one space) and are instructed to draw the front and side views. More details can be found on the Mathematics Task Centre website, as well as on Maths300.
December 12 to December 20: Project 1 – Foxes and Rabbits (ver. 1)
During my break from writing, I also worked on developing a game called Foxes and Rabbits, the rulebook for which can be downloaded below:
The premise of the game is inspired by predator-prey systems in nature. In short, Team Foxes are tasked with hunting enough rabbits to survive for 10 rounds, but not so many that they eliminate the entire population of rabbits. On the other hand, Team Rabbits are tasked with evading the foxes and ensuring the population survives for 10 rounds.
The game includes breeding mechanics (that need to be revised in later versions as the game is currently rabbit-favoured), as well as optional random events (requires a d20, although I hope to design cards in future versions).
Shoutouts to Ian Lizarraga and Mary Myerscough from MATH3063, as well as those who’ve trialed the game and given me feedback so far.
Future Plans
That’s pretty much all that I’ve done educationally-wise over the last two weeks. In terms of what I plan to do moving forward:
- I will hopefully get around to finishing a post listing Youtube channels about Mathematics that I’ve enjoyed over the last decade.
- I’ll also write up a post about manipulatives, concrete materials, everyday items and measuring devices that I think are worth using in the mathematics classroom.
- At some point I will throw out my thoughts about GeoGebra versus Desmos (TL;DR I think GeoGebra works better overall as a graphing and geometry tool, but Desmos has the slight edge in the function graphing and Classroom Activity department).
- Finally, I will continue auditing the Unit of Work websites for resource suggestions. Next up is Financial Mathematics, followed by Ratio and Rates.
