
‘Interactive’ Mathematics
- Interactivate: Interactive mathematics applets. They may be useful for visual demonstrations or experimentation, e.g. Function Revolution, or you might find some inspiration for activities, e.g. Buffon’s Needle (Explanation).
- Tim Brzezinski GeoGebra Resources: An extensive collection of GeoGebra activities, primarily focusing on 2D and 3D geometry, as well as algebra and functions. Very useful starting point if you want to incorporate GeoGebra and ICT usage/experimentation into your classes – GeoGebra in general has many activities and books worth checking out.
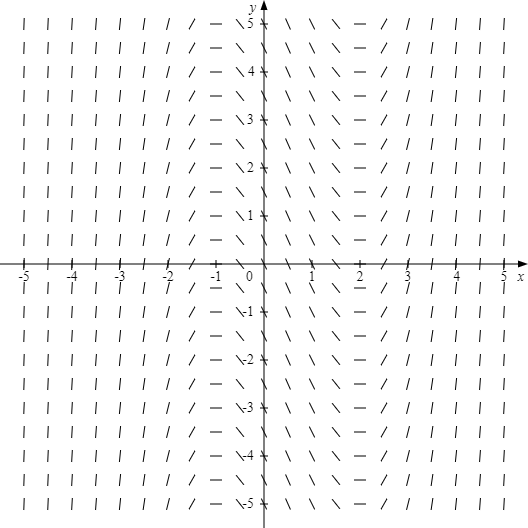
- Direction Field Diagrams: Simple tool created by Mr Drake for producing direction field diagrams – you can adjust the bounds and the size of the field, as well as the density of vectors. After producing the direction field, you can then save it and use it as a diagram (e.g. in a PowerPoint or worksheet).
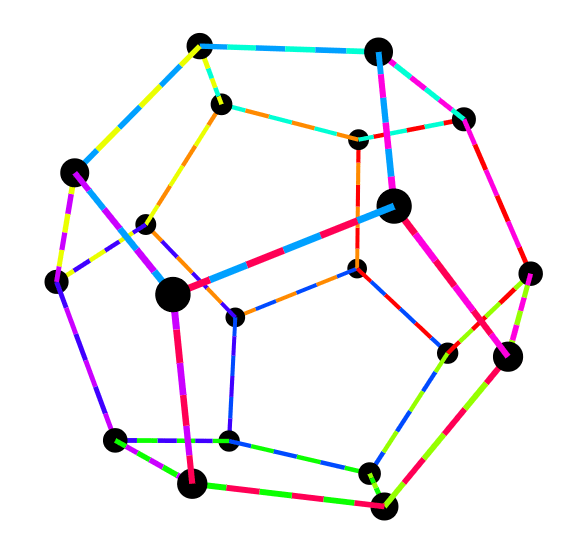
- Regular Polyhedra: A collection of regular polyhedra that can each be viewed in ‘3D’. Click the coloured segments to see the corresponding face of the polyhedra. Watch this video to learn more about all of the known regular polyhedra, beyond the commonly known platonic solids.
- The Game of Pig: A simple game – you continually roll a die, adding to a temporary total. You stop rolling if you either choose to stop (in which case, the total amount you have rolled up to that point gets added to your permanent total), or if you roll a 1 (in which case, nothing gets added to your permanent total). The goal is to reach 100 before the computer does. You can replicate this game in the classroom between students (or with the whole class participating, either as a free-for-all, or as class versus teacher). Pair the activity with an explicit discussion about arithmetic and probability (or consider what happens when you tweak the rules, e.g. more ‘bad’ dice numbers, or rolling two dice at a time). Supplementary Numberphile video and academic paper.
- Game of Life: John Conway’s famous Game of Life – a cellular automaton. The rules are simplistic, but they produce near-infinite potential for creativity. For more background information, consider reading this New York Times article, and this interview of John Conway (rest in peace) by Numberphile.
- XaoS: Do you want to show students fractals, but are dissatisfied with static images of Mandelbrot sets? Would you like to be able to produce and adjust fractals at will? Consider using XaoS – read through the documentation to learn how to use the fractal zoomer program. Note: if you try the demonstration on the website, you will notice that you run into a hard zoom limit (this is due to computing limitations) – to zoom back out, hold right click. For some extra fun, check out this Fractal Sound Explorer – take very good care of your ears though.
- Hyperpaint: A fun painting applet by Zokalyx – instead of a flat surface, you can paint in hyperbolic geometry. Can be a way to introduce the concept of non-Euclidean geometry to students (for novelty purposes).
- Fourier Drawing: Simple tool for demonstrating how the Fourier Series can be used to generate drawings (drawn in a single continuous line). GoFigure is a similar tool with a zoom-in feature for users to more easily track the vectors involved (if you plan to use it in the classroom though, my advice would be to hide the recent drawings).
For more background knowledge, consider watching 3Blue1Brown’s video on the Fourier Series.
- Virtual Manipulatives: A collection of basic manipulatives (in PowerPoint slide form) – useful in case you don’t happen to have the physical versions available in the storeroom, or if you want to be able to supplement in-class work with a digital demonstration.
- Field Play: Play around and generate pleasant-looking vector fields. Experiment in Field Play by changing the vx and vy functions or, alternatively, click the randomise button and allow the website to produce beautiful vector fields for you (tip: change the colour to correspond to either angle or velocity).
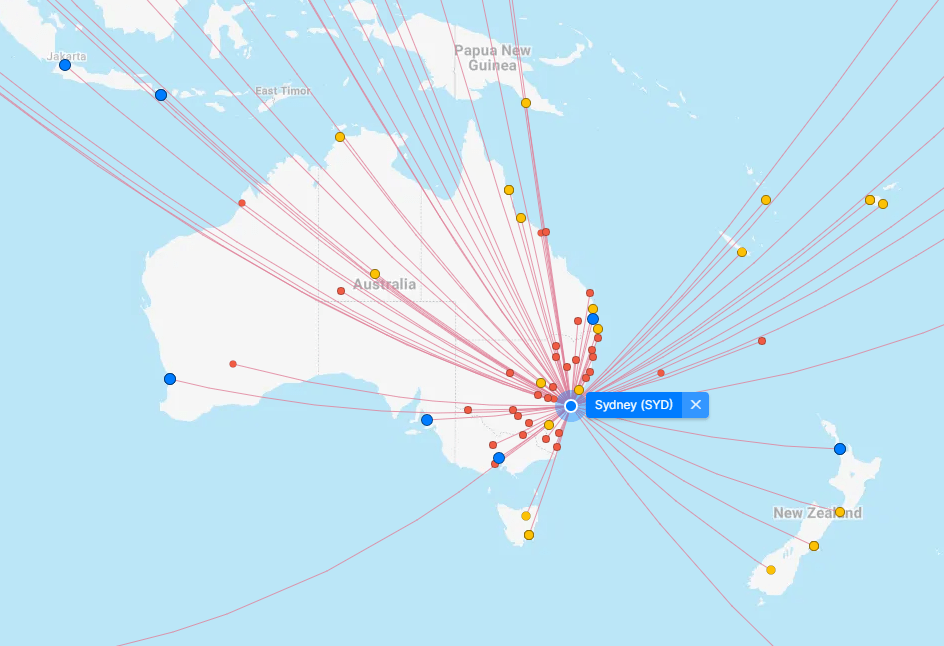
- FlightConnections: Website that shows all the connections between airports around the world. Could be a useful tool for creating airline-based network problems (e.g. creating authentic airport network maps with time, distance, or price included).
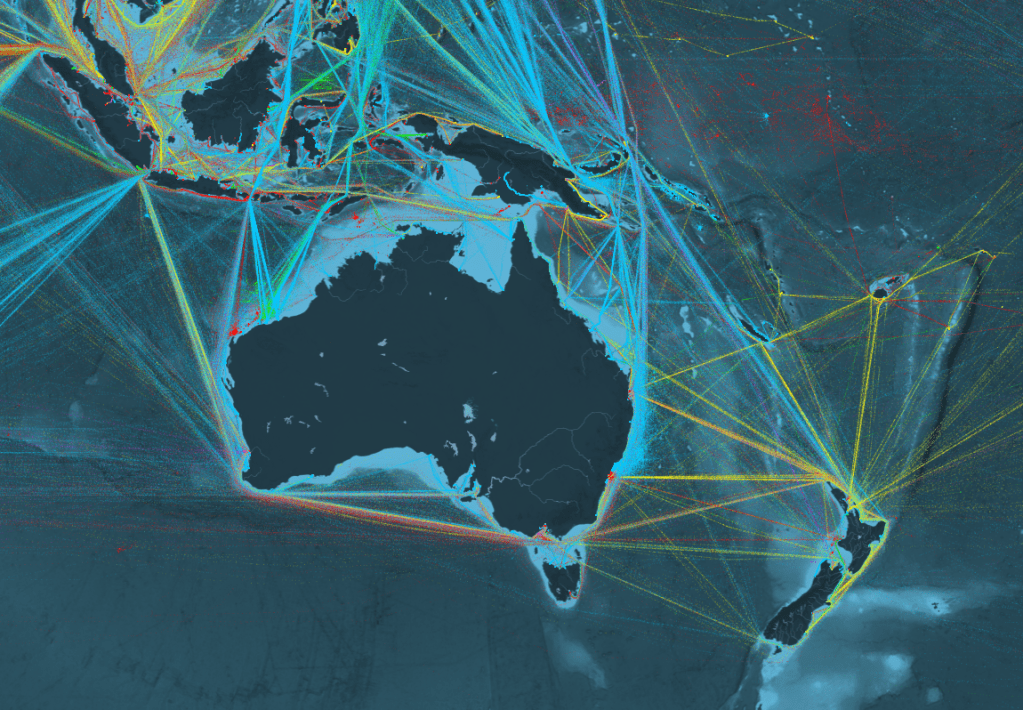
- ShipMap: Animated map of ships travelling around the world during the year 2012. You can select filters and colours to differentiate between boat types (e.g. container ships). Instead of looking at individual boats, you can also look at shipping routes between ports. Mostly visually interesting – you can use this as a network example to demonstrate the interconnectedness of the world (at least, in terms of shipping). Consider also checking MarineTraffic or VesselFinder if you want live data.
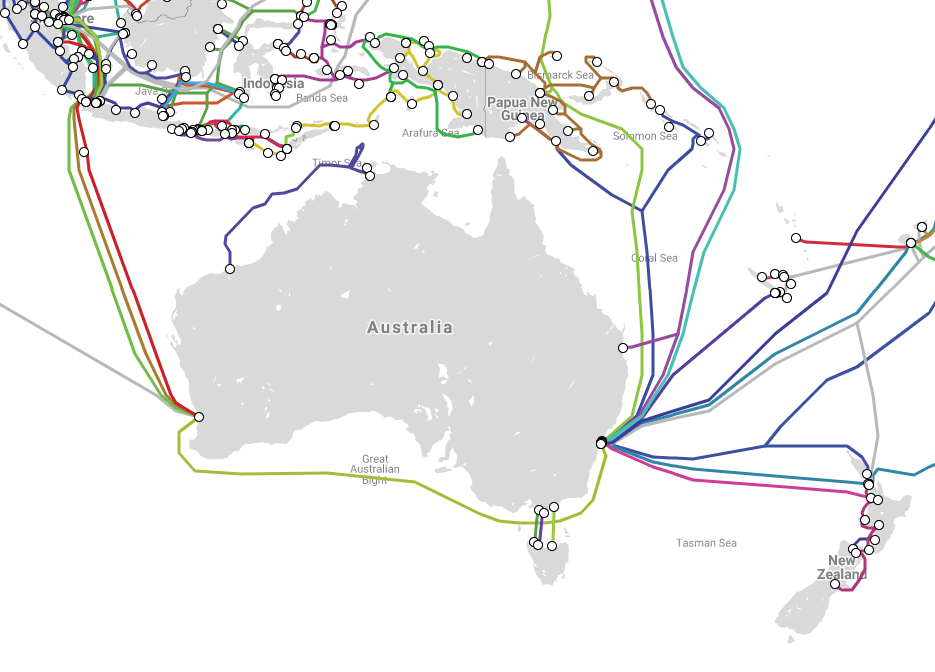
- Submarine Cable Map: A map of underwater communication cables across the world. Could be of great interest to students who have never considered how data is transferred between countries and continents. Can also serve as stimulus for network problems.
Previous Page: ‘Recreational’ Mathematics
Next Page: Mathematics Lessons and Activities
