
Digital Tools and Data
- Ractive Player: A useful tool for creating interactive videos in HTML, CSS or Javascript. It will require a lot of time to learn in order to get the most out of it – consider quickly browsing through the documentation to determine whether or not you would like to use Ractive Player.
- Manim: “Animation engine for explanatory math videos.” Engine developed and used by 3Blue1Brown and others to produce animated mathematics videos. Official documentation is available but in progress; a tutorial can also be found here.
- Replit: An online environment that can allow students to code together in real-time. This will likely only be useful if you plan to implement coding exercises for your class. An (also free) alternative is Microsoft’s Visual Studio and it’s Live Share feature.
- Mathcha: An online mathematics-friendly editor – supports the easy insertion of graphs, diagrams, and mathematical notation. I found it relatively easy to use this year when I was taking notes for my abstract algebra university course. Consider showing this to your students if they are looking for a tool to write (neat) mathematics notes during or outside of class.
- The LaTeX Project: Free software for producing high quality mathematics and scientific documents or worksheets. Requires some initial learning and setup – consider working through this online tutorial or this workbook. Alternatively, try out Overleaf, a (premium) online LaTeX editor that allows for live collaboration.
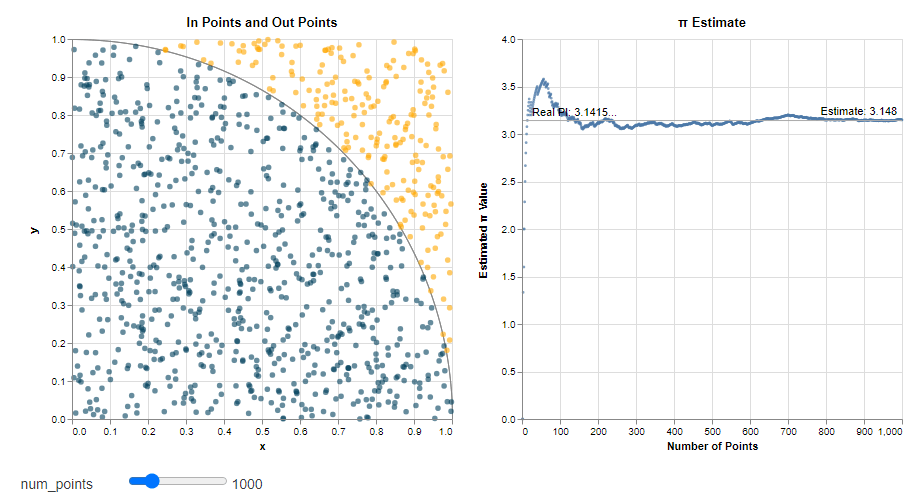
- Vega: Vega is another online data visualisation tool that’s relatively easy to use (if you read through the tutorials) – you can modify some of the existing examples they have, or you can use the tools provided by the language to produce your own unique interactive graphs and diagrams. Consider checking out their visualisation of the Pi Monte Carlo simulation.
- Map Customizer: Simple online tool for making maps with location markers. Might be useful for topics such as interpreting maps, networks, or as stimulus for creating travel graphs.
- WriteSpace: An online notepad tool that supports Markdown, KaTeX and code blocks. To learn more, browse through the user guide and the KaTeX documentation.
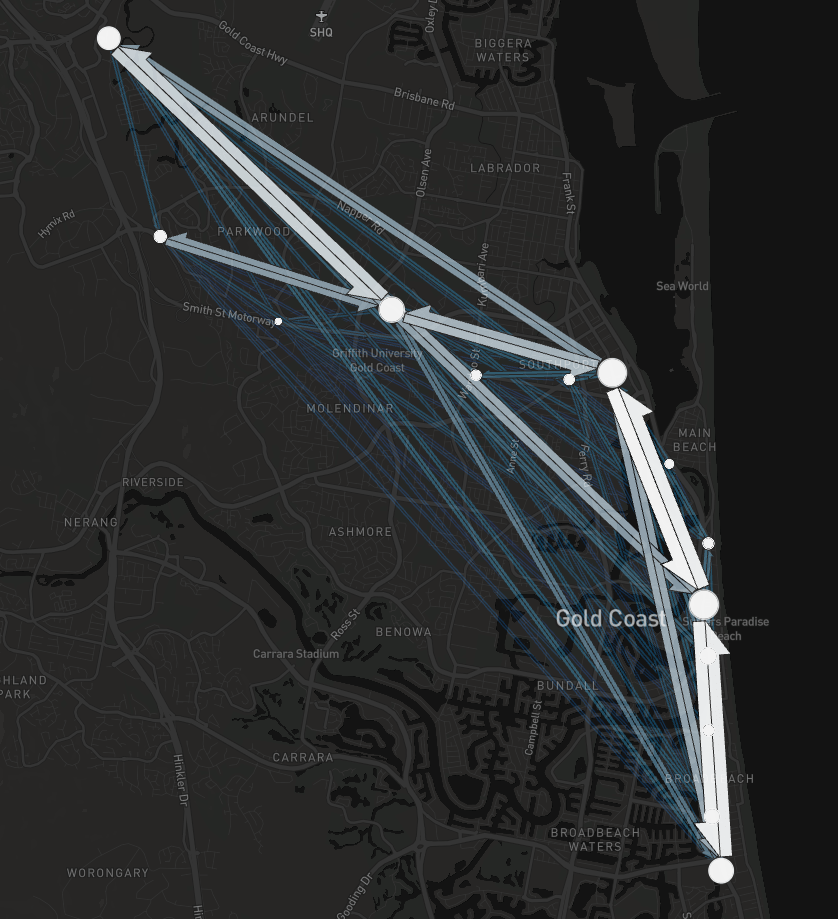
- Flowmap.blue: You can use flowmap.blue as a source of interesting real-world examples of networks. Alternatively, if you happen to have or find a suitable data set, or if you want to modify an existing set of data, you can also use the tools provided by the website to produce your own flow map.
- Kepler: Another large-scale data visualisation tool. Unless you have access to large amounts of geospatial data (you can try looking up datasets online, e.g. for earthquakes or migration), it’s very likely you’ll only check this tool once out of curiosity. Still somewhat interesting and worth checking out the examples available. Maybe it might convince one of your students to get into data visualisation and urban planning as a future career?
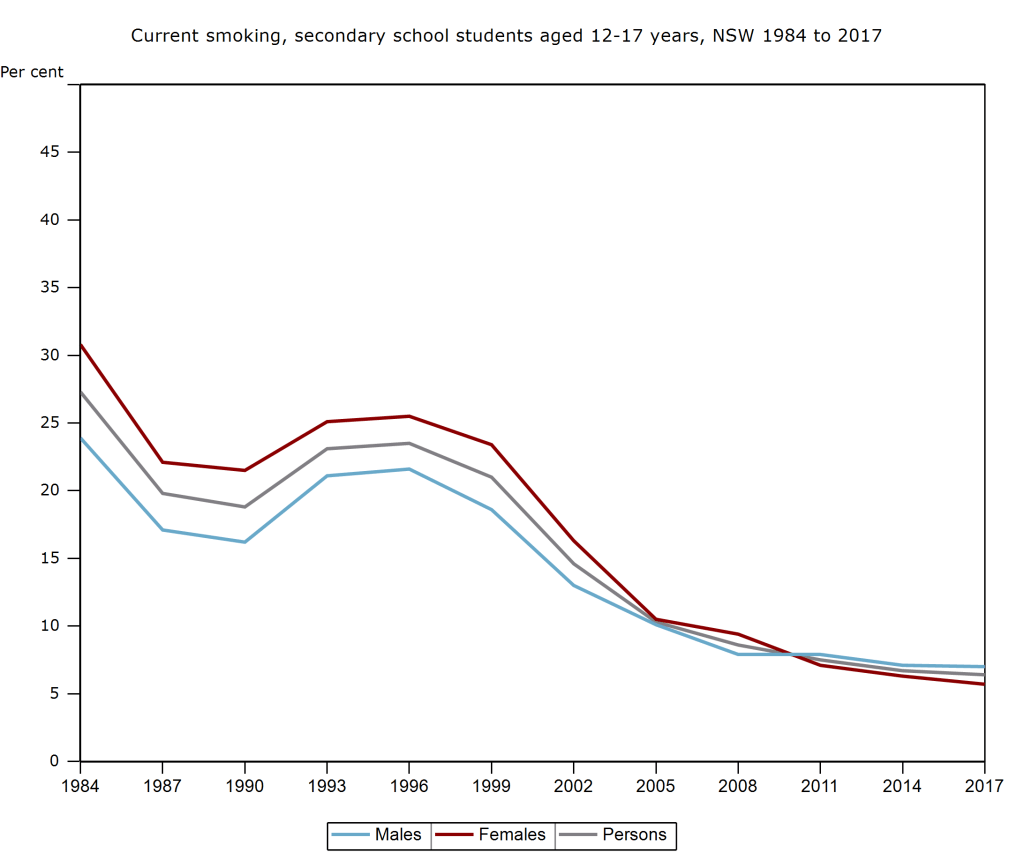
- HealthStats NSW: A large database of health-related statistics, accessible as both graphs and table data. Available topics include Cancer, Communicable Diseaess, Life Expectancy, and Physical Activity. Statistics from these topics could, for instance, form the basis of a poster assignment informing the school or public about a health issue.
- Our World In Data: Data and charts for many topics and issues (e.g. food production, deaths from various causes, carbon dioxide emissions). The website can serve as a place for your students to obtain and interpret examples of real-world data.
- OECD Regional Wellbeing: Well-being statistics for various regions across 38 OECD countries. Using New South Wales, Australia as an example, you will find ratings (compared to other OECD regions) for metrics such as education, environment, and health. You can also download the data (available in spreadsheet form).
- MoneySmart: The MoneyStart website (produced by the Australian government and the ASIC) hosts several resources for teaching financial mathematics, from K to 12, as well as VET content. Examples: ‘How can we reduce our spending?‘ (comparative shopping, mobile phone plans); ‘How can we access money overseas?‘ (currency conversion, fees); and ‘Rookie: Car Ownership‘ (car costs, loans, insurance). MoneySmart also hosts a few useful tools: Budget Planner; Supperannuation Calculator; and Mortgage Calculator.
Final Thoughts
Before you consider using any of these resources in the classroom, think critically about how you or the students will be using them, and what kind of learning outcomes you are aiming to achieve by the end of the lesson. Make sure to modify the resources (as much as possible) to suit the needs of your particular class. Alternatively, simply use the resources above as sources of inspiration for your own self-developed materials or activities.
Acknowledgements: Thank you to primeclimber from Teaching By Numbers, as well as Maria Quigley and Stuart Palmer from the University of Sydney, for their guidance over the last few years.
Previous Page: Interesting Mathematics
